


Track data shows MASSIVE Red Bull advantage over rivals
Ex-F1 aerodynamicist Shubham Sangodkar unpacks the huge gap between Red Bull and the field
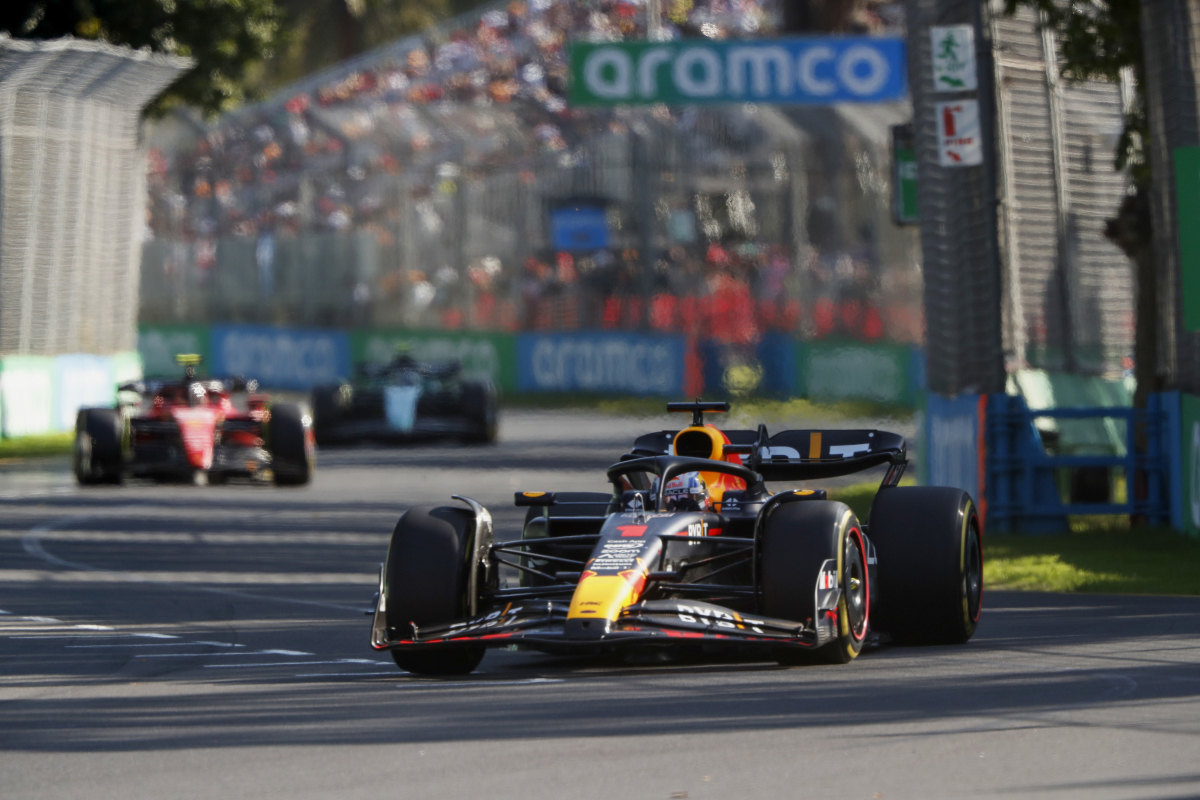
The Red Bull RB19s were in a class of their own at the Saudi Arabian Grand Prix. Even though Max Verstappen had driveshaft issues in qualifying on Saturday, which meant he had to fight back from 15th on the grid, there was no stopping him as he breezed past his main competitors without them being able to resist the impressive Red Bull straight-line speed advantage.
"I've definitely never seen a car so fast," Lewis Hamilton later said. "I think when we were fast, we weren't that fast. I think it's the fastest car I've seen, especially compared to the rest."
Even Carlos Sainz and Fernando Alonso didn't bother putting up a defence, and decided to play the long game for the race. So how what picture does the data paint, and does it support the driver's comments about the RB19? Let's dive in!
Team upgrades and setup options for Saudi Arabia
Before we dive into the data, it's important to understand what setup configurations teams went for during the race, as this has a direct implication on the data trends we can observe.
Red Bull was the only team with a dedicated low-drag package encompassing a rear wing mainplane and flap, and single-element beam wing. This showed how the team were much more prepared than its competitors, because the likes of Mercedes, Ferrari and Aston Martin basically brought ‘trim’ packages.
That is a product of the cost cap era, in which teams trim existing parts to accommodate certain tracks instead of investing in new parts. This means that Red Bull probably had a more optimised package to begin with, on top of their amazing aero efficiency compared to the rest of the grid.
The DRS effectiveness plot
The main plot we want to obtain is the speed vs acceleration plot for DRS on and off. This plot tells you two things, firstly how the acceleration of the cars varies with speed and secondly, how much acceleration you obtain with the DRS on. By comparing this plot for various teams, we can observe where their relative strengths lie.
We have adopted a specific strategy to collect relevant data points in order to obtain correct data-driven trends. We have filtered the data to remove low-speed points and included data points in only the DRS zones and where the DRS on speed range is relevant.
Additionally, we have removed any abnormal data points which may arise due to safety cars or yellow/red flags, so that the data quality and thus the trends are representative. A linear function is then fitted using the data points in the scatter plot.
The fitted linear function is then used to compare the DRS effectiveness over the speed range between two drivers. In our analysis, we will jump straight on to comparing the linear function, as that tells the story quite elegantly.
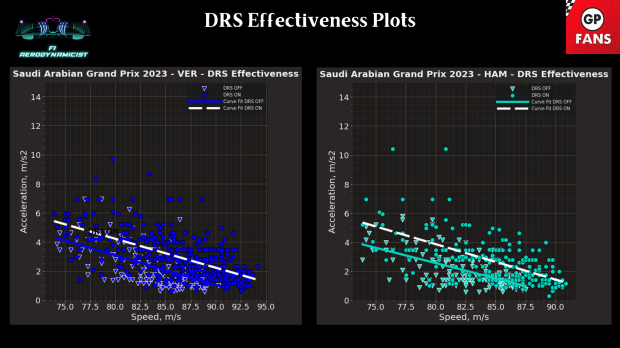
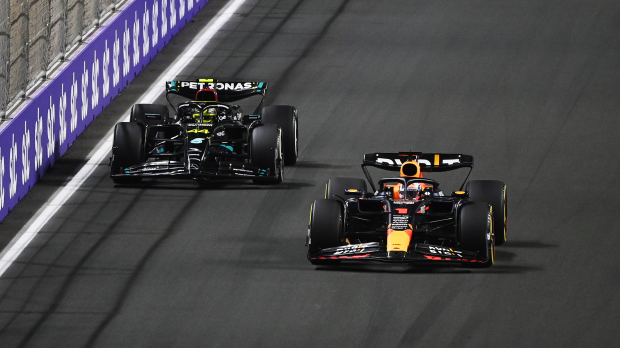
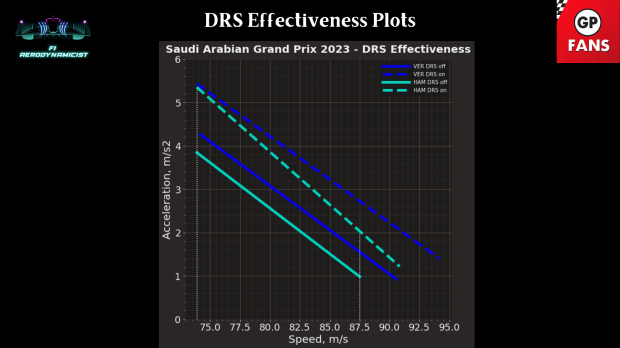
Verstappen vs Hamilton
When we compare Verstappen and Hamilton, the DRS on case clearly shows the optimised package and aero efficiency advantage that Red Bull have. The Red Bull accelerates 10-13% faster across the entire DRS speed range without DRS.
With DRS on, Hamilton actually matches the initial acceleration, which is probably masked by an energy deployment strategy in which teams try to avoid giving the slipstream to other drivers at the deployment zone because it further helps them close the gap.
As we look into the high-speed spectrum, the two dashed lines clearly diverge. This shows the true prowess of the RB19, as its DRS effectiveness in terms of acceleration is unchanged through the entire DRS speed range (observe how the dashed and solid lines are actually almost parallel to each other). Numerically, in Saudi, at around 300km/h Red Bull has about 30% more acceleration than a Mercedes.
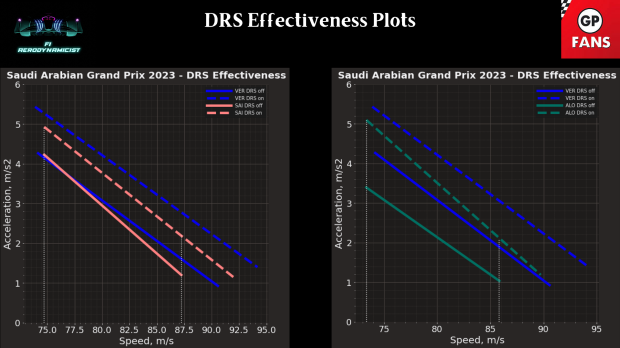
Verstappen vs Sainz vs Alonso
Verstappen vs Sainz with DRS off is quite similar to begin with, but the advantage grows with speed. With DRS on, however, there is a clear offset initially, and that offset grows with speed. At around 300km/h, RedBull’s DRS effectiveness is about 20% higher than Ferrari's.
The Aston Martin comparison with Red Bull is shocking. Verstappen could easily hold back Alonso with his DRS on hypothetically. No wonder Alonso didn't even bother fighting with Verstappen with DRS on when he came around to overtake him on lap 21. In terms of numbers, at around 300km/h RedBull has 45% more acceleration than an Aston Martin.
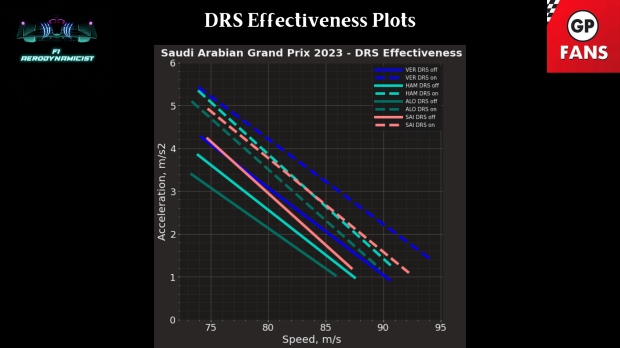
How do they all stack up together?
Comparing the data for Verstappen, Hamilton, Alonso and Sainz together, we can get a picture of DRS effectiveness if teams run similar setups on speed-sensitive tracks. Leading the pack is Red Bull with their high aero efficiency, with the rest of the grid being Ferrari > Mercedes > Aston. The single biggest takeaway is that, for all the other three teams, the DRS effectiveness decreases at a higher rate with speed compared to RedBull.
What can be the potential reason for this strange trend? Check out this article for more insights.
READ MORE: Christian Horner: The Red Bull giant and ‘Drive to Survive’ star
Related
More F1 news
Latest F1 news


Recommended by the editors
 Latest F1 News
FIA steward admits Max Verstappen makes it hard to be punished: 'He challenges us'
 Mercedes
Toto Wolff admits Mercedes F1 cost cap fears with new upgrades plan
 Lewis Hamilton
Lewis Hamilton gearing up for F1 title showdown: 'Ferrari are pushing hard'
 F1 Analysis
Adrian Newey is building an Aston Martin title winning car and here is the F1 star who will drive it


Races
-
 Grand Prix of Australia 2026
-
 Grand Prix of China 2026
-
 Grand Prix of Japan 2026
-
 Saudi Arabian Grand Prix 2026
-
 Miami Grand Prix 2026
-
 Grand Prix du Canada 2026
-
 Grand Prix De Monaco 2026
-
 Gran Premio de Barcelona-Catalunya 2026
-
 Grand Prix of Austria 2026
-
 Grand Prix of Great Britain 2026
-
 Grand Prix of Belgium 2026
-
 Grand Prix of Hungary 2026
-
 Dutch Grand Prix 2026
-
 Grand Prix of Italy 2026
-
Gran Premio de España 2026
-
 Grand Prix of Azerbaijan 2026
-
 Grand Prix of Bahrain 2026
-
 Grand Prix of Singapore 2026
-
Grand Prix of the United States 2026
-
 Gran Premio de la Ciudad de Mexico 2026
-
 Grande Prêmio de São Paulo 2026
-
Las Vegas Grand Prix 2026
-
 Qatar Grand Prix 2026
-
 Grand Prix of Abu Dhabi 2026
Follow us on your favorite social media channel
Editorial & corporate information
Avenue HQ
10–12 East Parade
Leeds
LS1 2BH
United Kingdom Regional correspondence
View contact page